April 13, 2026
Validating CFD Against Wind Tunnel Data
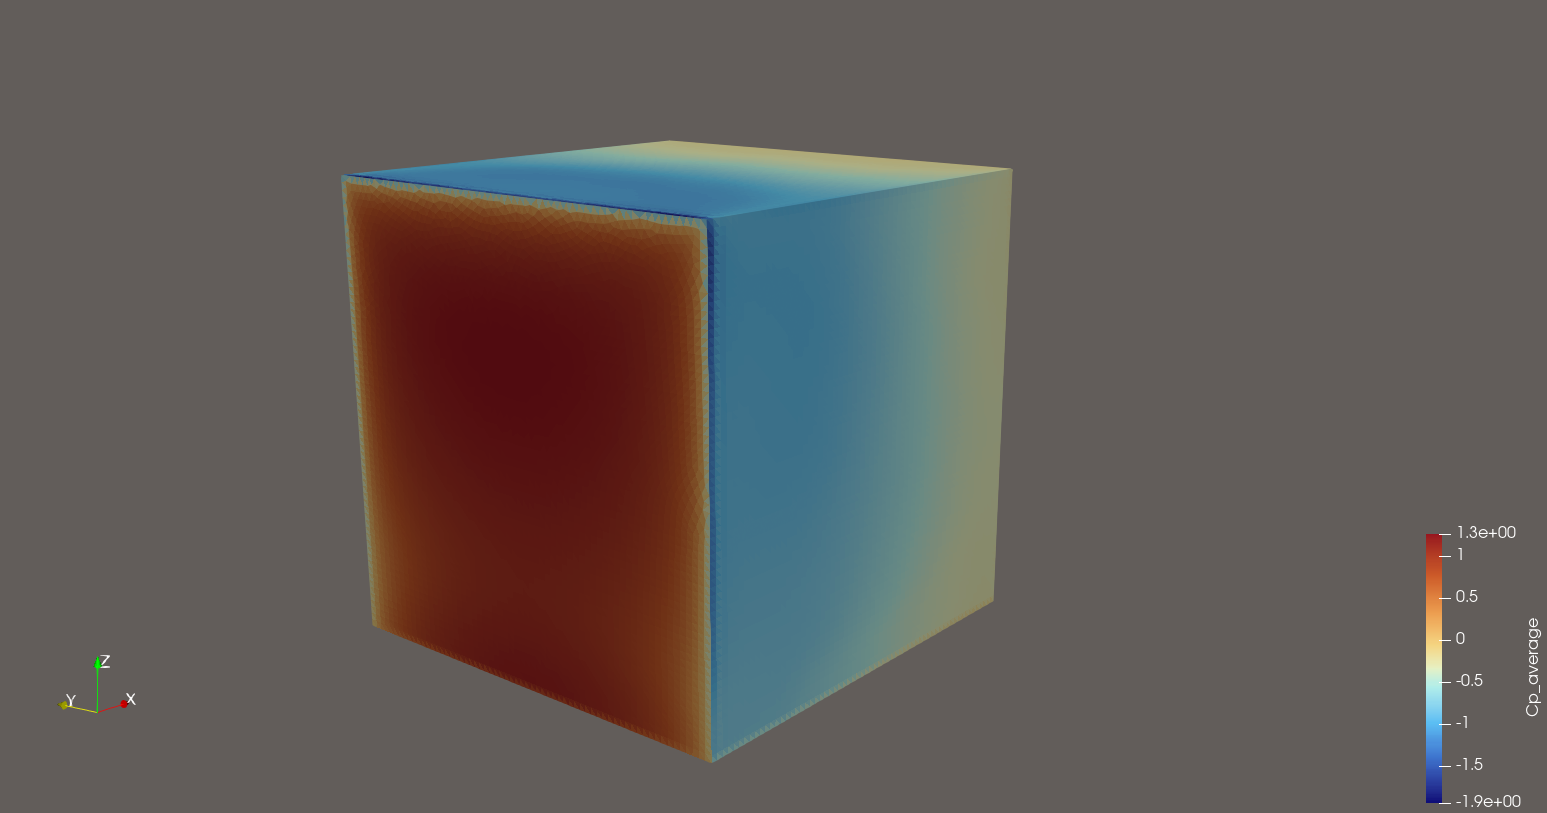
Every wind engineering decision rests on a single question: can you trust the numbers? Wind tunnel testing has answered that question for decades, but as Computational Fluid Dynamics (CFD) moves into structural design workflows, the burden of proof shifts to the solver. A pressure coefficient that looks reasonable in a contour plot is not the same as one that matches a calibrated wind tunnel measurement at hundreds of probe locations across multiple wind angles. The difference matters when those values feed into facade design or structural load calculations.
AeroSim publishes its validation portfolio openly - not as marketing, but as a technical record that engineers and reviewers can interrogate directly.
Why Validation Scope Matters
A solver validated on a single canonical case proves little. Wind engineering covers a wide range of applications - high-rise and low-rise buildings, open-terrain boundary layers, topographic flows, pedestrian-level comfort, among others - and each stresses different aspects of the simulation chain.
AeroSim's validation portfolio spans several categories chosen to cover this breadth:
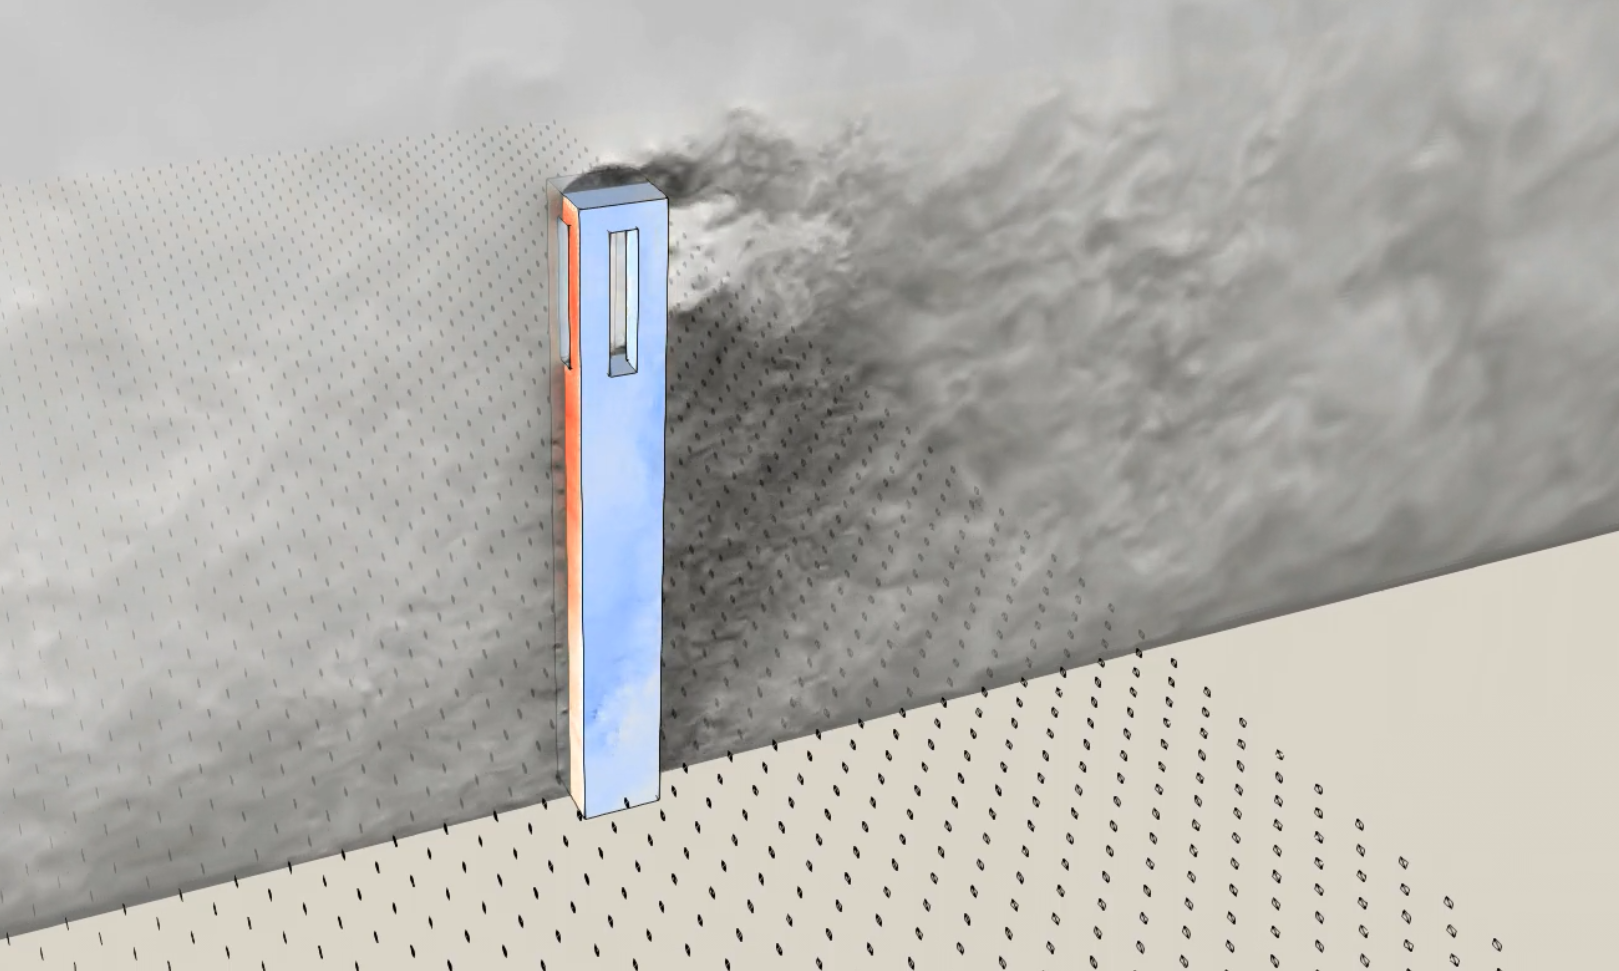
- High-rise buildings - the CAARC standard model, complex-shaped towers, and configurations of adjacent high-rise pairs with varying gap sizes
- Low-rise buildings - the NIST aerodynamic database gable-roofed building and a flat-roofed building with neighboring structures
- Atmospheric Boundary Layer (ABL) and topography - boundary layer profiles for multiple terrain categories (EN 1991-1-4), a 2D slope, and the Bolund Island field measurement campaign
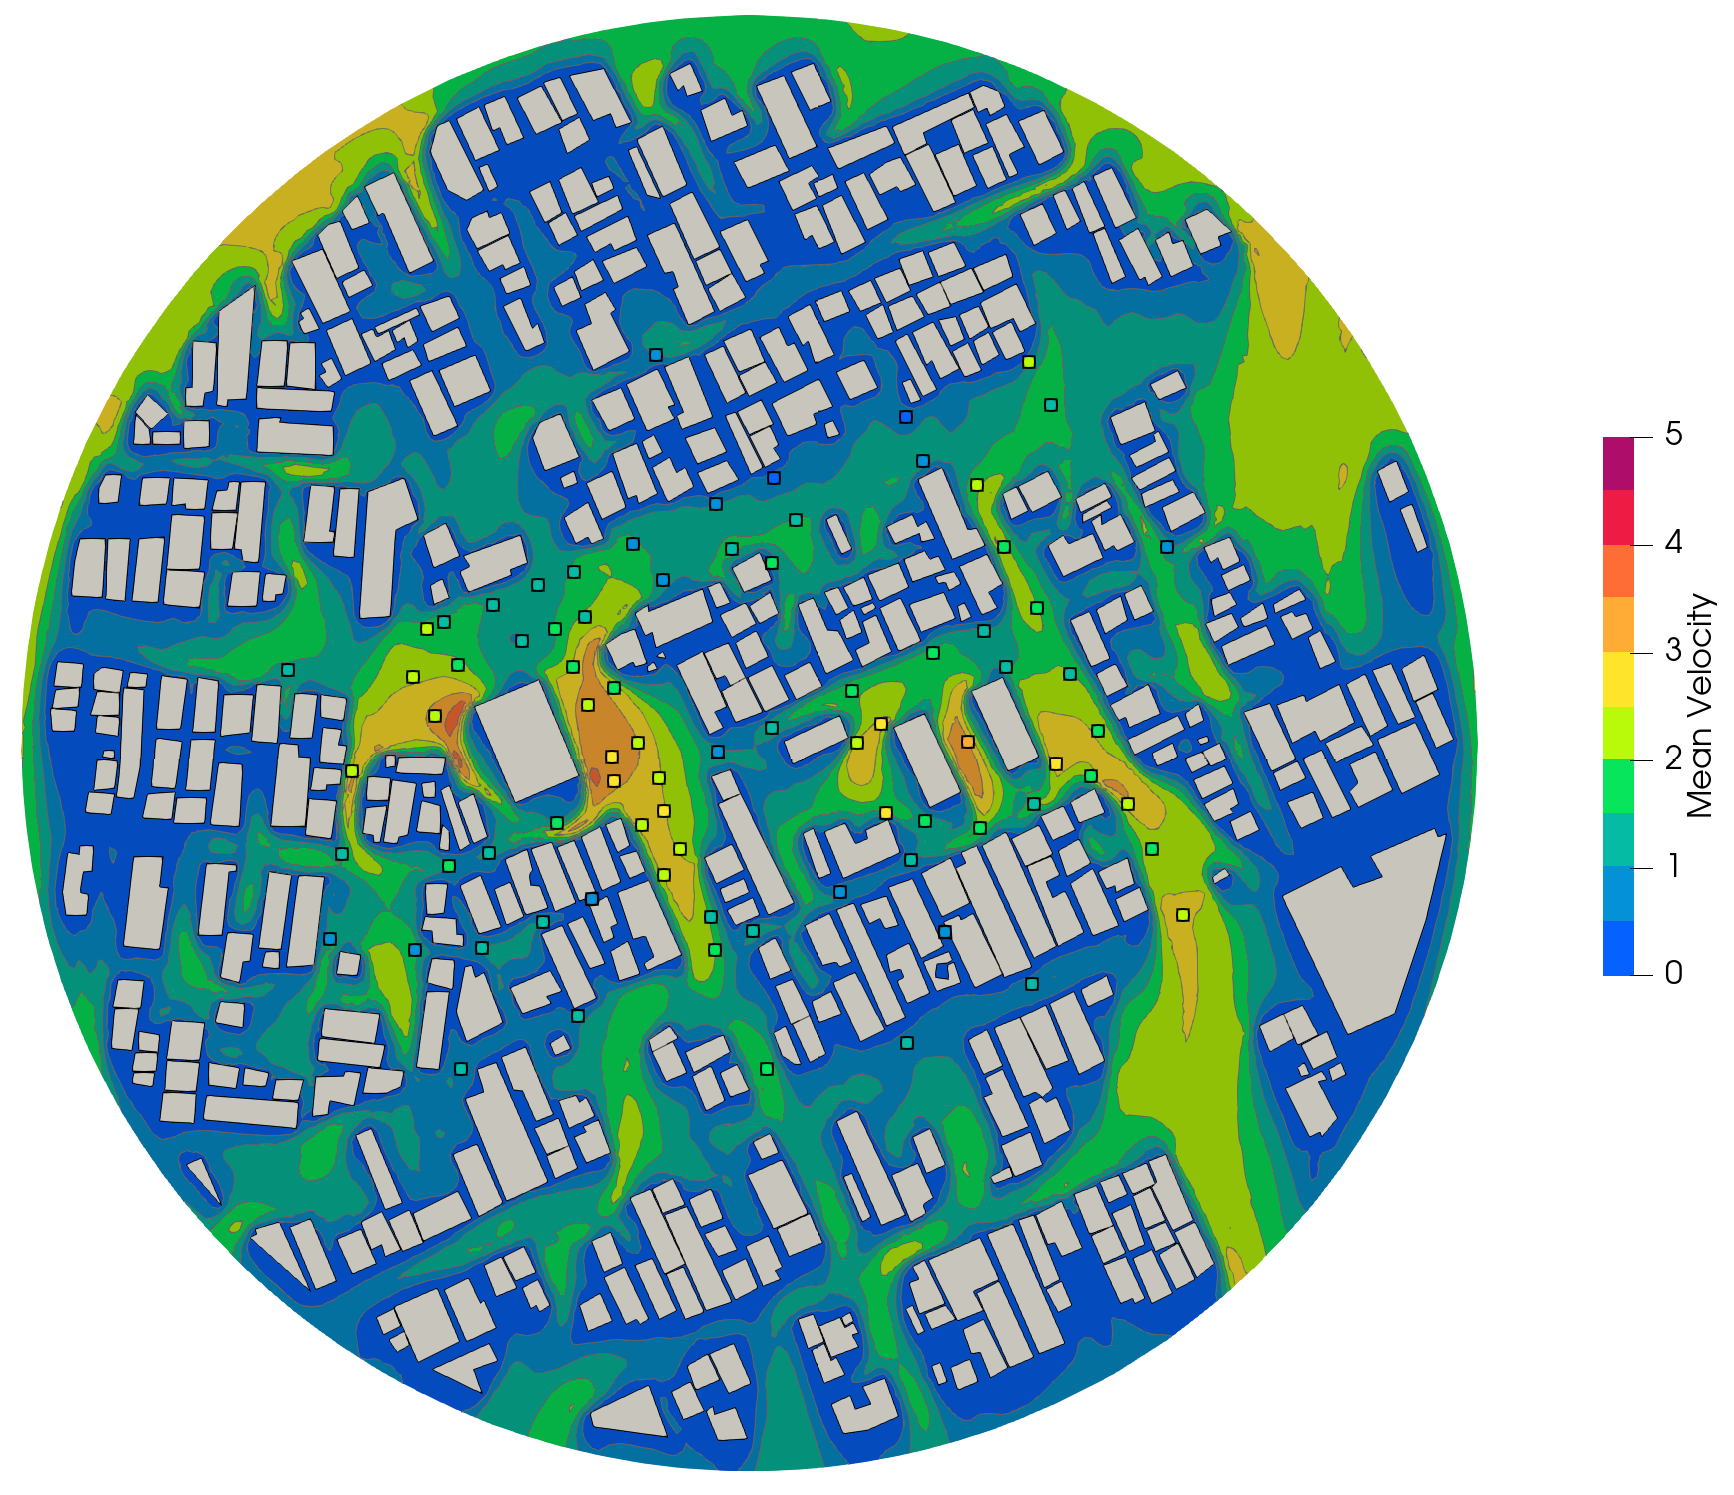
- Pedestrian wind comfort - the Niigata urban center from the AIJ guidebook for CFD predictions
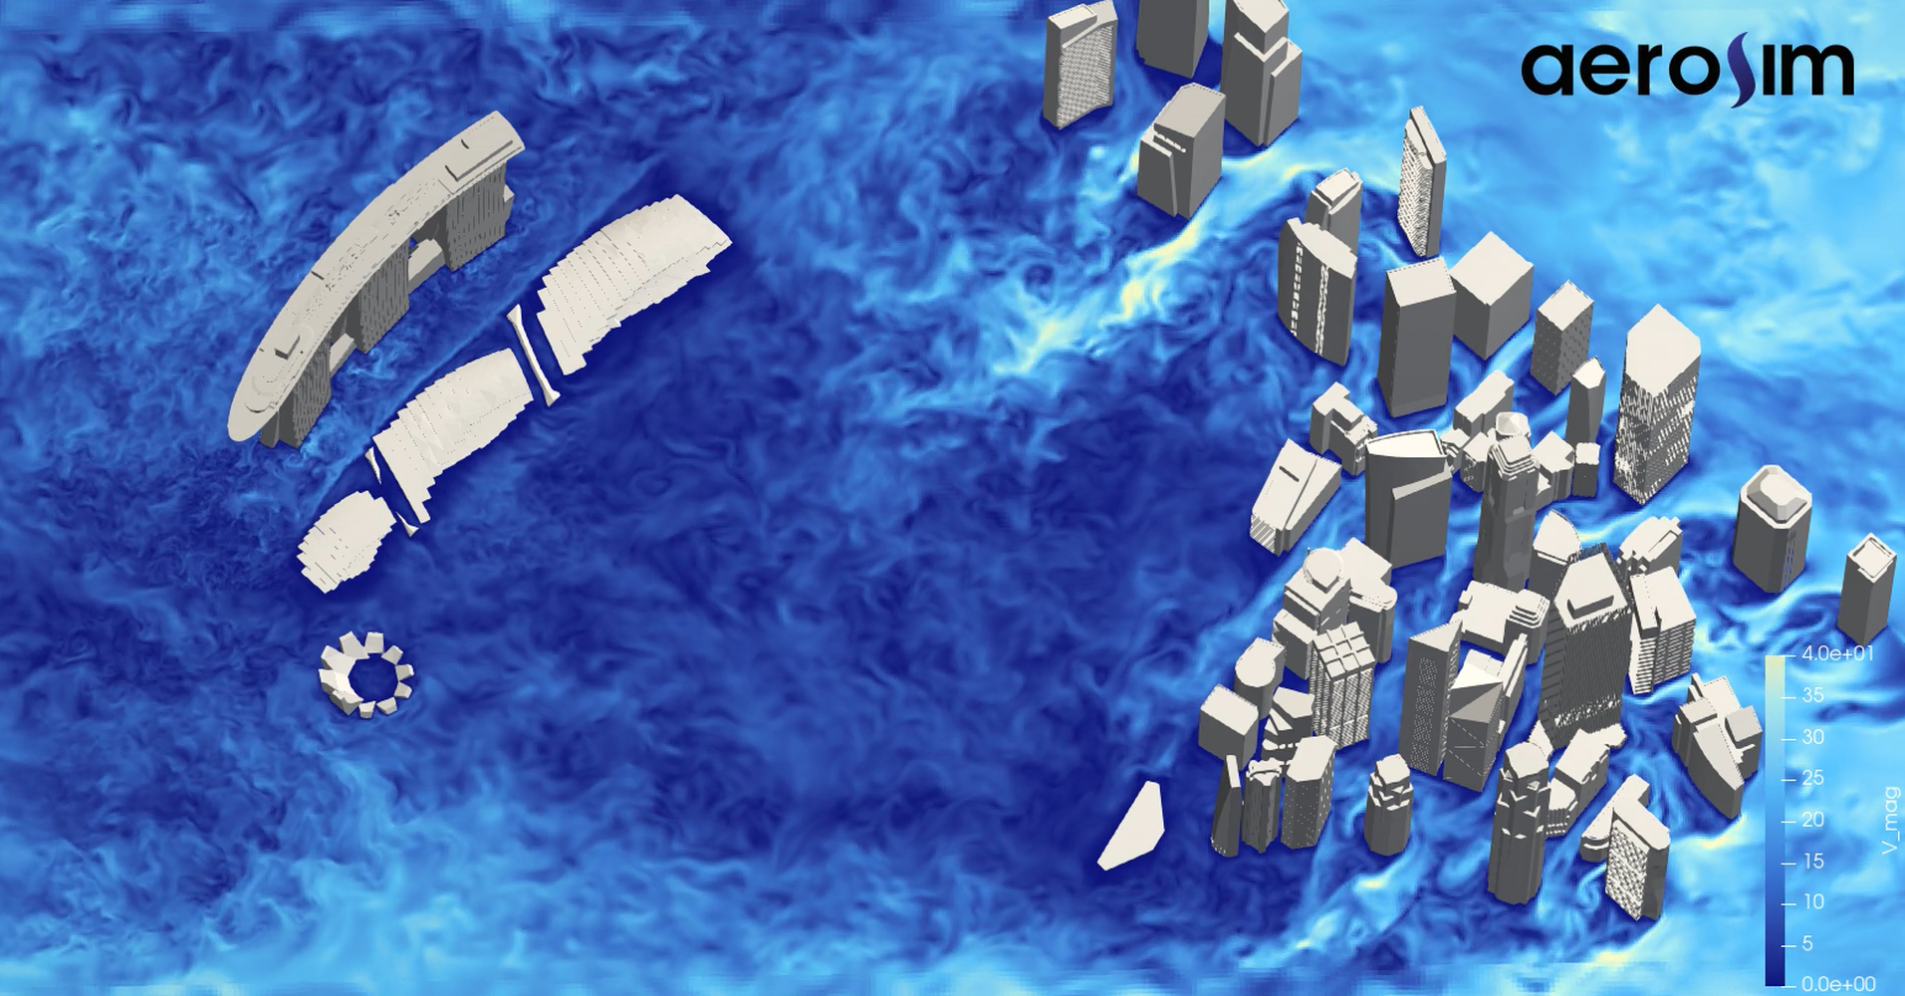
- Real-world buildings - a residential high-rise with full urban surroundings and an airport terminal with rooftop pressure probes
Each case compares simulation results against experimental wind tunnel data or field measurements, not only in mean values but also in the quantities that drive design decisions - peak pressures, force spectra, and higher-order statistics.
The Validation Methodology
Validation in wind engineering is not simply overlaying two curves. AeroSim applies a consistent methodology across all cases that mirrors wind tunnel post-processing practice.
Inflow Calibration
Every case begins with an empty-domain simulation. A probe line is placed where the building will stand, and the mean velocity, turbulence intensity, integral length scale, and power spectral density are measured and compared against target profiles. For ABL cases, the target follows the logarithmic profile from EN 1991-1-4. For wind tunnel reproductions, the target matches the documented tunnel inflow. This step is reported explicitly - if the inflow is wrong, no downstream comparison is meaningful.
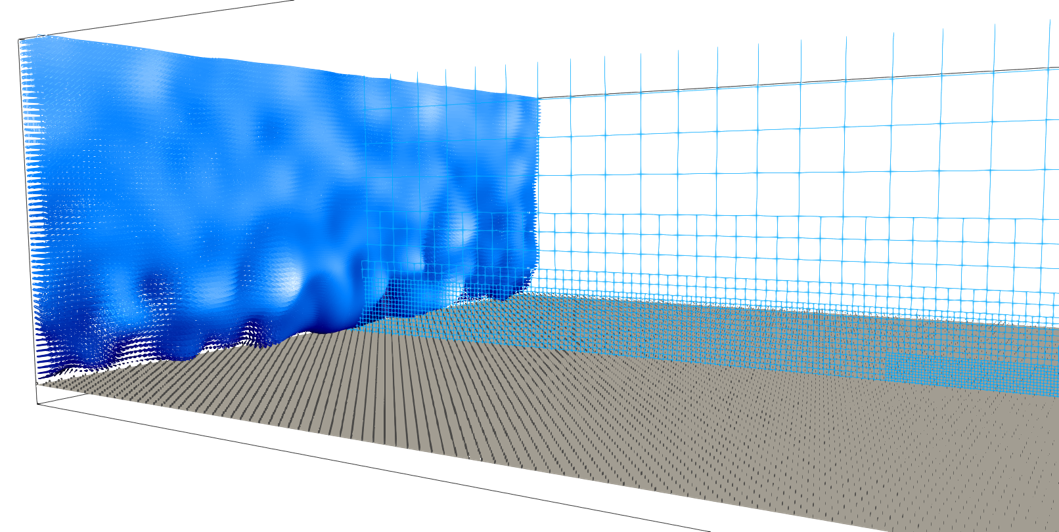
The Synthetic Eddy Method (SEM) generates turbulent inflow at the inlet, and solid fins distributed across the floor adjust the velocity and turbulence profiles to match each terrain category. Energy spectra are compared against theoretical curves (Von Karman for ABL cases, experimental spectra for wind tunnel reproductions) to verify that the turbulent content is physically consistent, not just statistically correct in mean and variance.


Statistical Processing
Peak pressure coefficients are sensitive to the statistical method used. In wind tunnel practice, the experimental signal is typically split into several sub-samples (e.g. 6 runs of 10 minutes each), and extreme values from each sub-sample are fitted to a Gumbel distribution to estimate the peak. In the complex high-rise cases, AeroSim applies the same statistical procedure to its single continuous time history:
- A -second moving average is applied to the signal
- The processed signal is subdivided into intervals, from which min/max values are extracted
- Extreme values are fitted to a Gumbel distribution
- Shape parameters are rescaled to a reference duration
Applying the same peak estimation procedure to both numerical and experimental data removes a common source of discrepancy in CFD-to-tunnel comparisons.
Quantitative Error Metrics
Agreement is quantified using mean absolute error (MAE) and normalized mean absolute error (NMAE):
Scatter plots at each wind direction show probe-by-probe deviations, not just surface-averaged values. Higher-order statistics - RMS, skewness, kurtosis, and pressure spectra - are also reported, because matching the mean is necessary but not sufficient for transient load applications.

Beyond Pressure: Forces and Spectra
For the real-world residential high-rise, validation extends to floor-by-floor force coefficients. Mean, peak, and RMS force coefficients are compared against wind tunnel time histories, and force spectra are matched across frequency to verify that the simulation captures the correct energy distribution - critical for resonant response calculations.

The Bolund Island case takes a different angle entirely. Here the reference data comes from full-scale field measurements, not a wind tunnel. Mean velocity profiles are compared at multiple probe positions across the island for different wind directions, testing the solver's ability to handle sharp topographic features and flow separation.

What This Means for Practice
A public validation portfolio allows engineers and reviewers to assess the solver's behavior on cases similar to theirs, with transparent methodology and quantitative error metrics. The breadth of AeroSim's validation portfolio - from the CAARC benchmark to real airport terminals, from flat terrain ABL profiles to Bolund Island field data - provides the evidence base for that confidence.

Aron Zavelinski
Engineering Manager
Aron is a computational wind engineering (CWE) researcher specializing in wind effects on safety and comfort, with over 4 years of experience in the field.