

Metallic elements are widely used in supporting roofs for low-rise buildings like warehouses and stadiums because they offer a good strength-to-weight ratio. However, their lightweight nature makes wind action a crucial factor in their design. Depending on the architectural design and surrounding topography, using analytical solutions from wind codes can lead to design uncertainties. To address this, engineers and architects have turned to computational fluid dynamics (CFD) as an alternative solution. CFD allows them to simulate wind behavior and has gained interest in the industry.
In this blog post, we'll explore AeroSim's digital wind tunnel results using large eddy simulations (CFD-LES) to study the wind load on the roof of a standard warehouse. The main goal is to assess the feasibility and accuracy of this approach for structural designs of low-rise buildings.
Digital domain
In this post, we reproduce one of the cases evaluated in the NIST/TTU Cooperative Agreement - Windstorm Mitigation Initiative, a project jointly funded by the National Bureau of Standards and Technology and Texas Tech University. The reference for the present study is the test 1 of the second phase of the experiment, which involved measuring the external pressures on a model of a two-story shed with eaves height, width, and length equal to 20, 100 and 200 ft, respectively, at a 1:200 scale. Additionally, the roof pitch is 1:24. The digital domain is illustrated below.
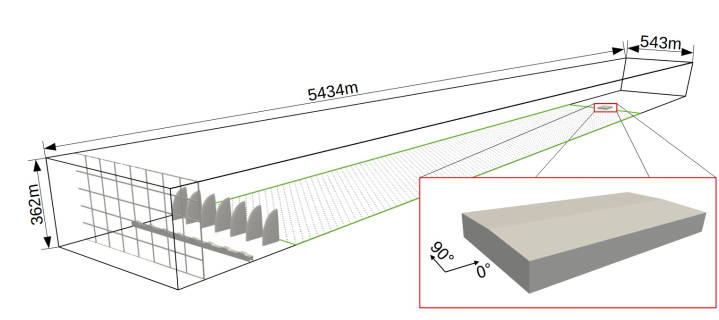
The boundary condition at the inlet is a turbulent flow from a precursor simulation with a smooth plane. At the ceiling and side walls of the digital wind tunnel, a free-slip condition was imposed. A structured Cartesian grid with varying refinements for each region of interest was used. The finest grid resolution utilized was H/Δx = 42, used to wrap around the building, where H represents its height.
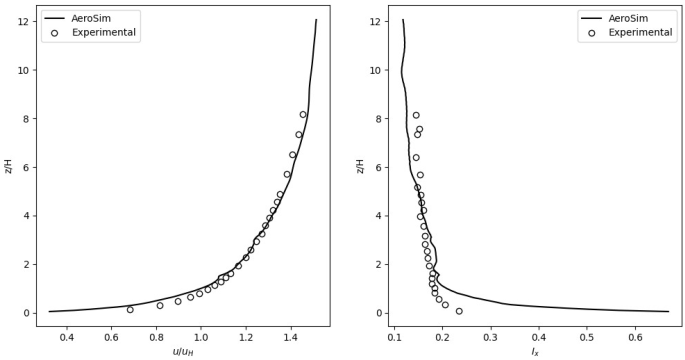
The domain is long enough to allow the development of the appropriate atmospheric boundary layer properties. The modulation of the atmospheric boundary layer flow is given by the elliptical towers and roughness elements, which are intended to reproduce an open country terrain. The mean velocity and turbulent intensity profiles are depicted in figure below.
A sampling of 600 CST = H/U_H (convective time scale), where U_H is the mean wind velocity at height H, was captured with a time step equal to CST/1060. The problem scaling was controlled through the Reynolds number, defined as H.UH/ν, where ν is the kinematic viscosity of air. For the conducted simulations, a Reynolds number of 8.34x10^4 was used, the same as in the experimental solution. In the experimental setup, the length scale (H) is reduced compared to the real scale. In contrast, in the numerical solution, the velocity scale (U_H) was reduced to maintain the same Reynolds number. Each simulation took approximately 4 hours of processing on a GPU Nvidia Tesla V100.
Pressure coefficients
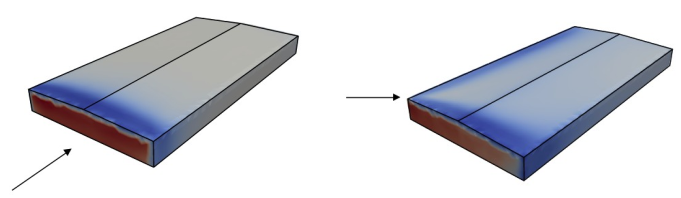
The animation below shows how the wind behaves on a slice across the shed’s midplane. At the windward facade, the pressure is positive, meaning that the air is pushing the wall towards the inside of the building. In all the other surfaces, the mean wind action is negative (suction), check the figure below. The flow separates at the windward edge, creating a high suction zone. Most of the incidents of roofing lift off originate in this zone. However, at a short distance from the edge, the wind loads on the roof decay to a very small value, because the separated flow re-attaches to the surface.
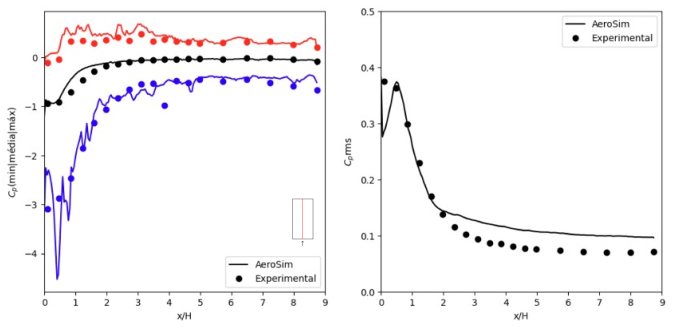
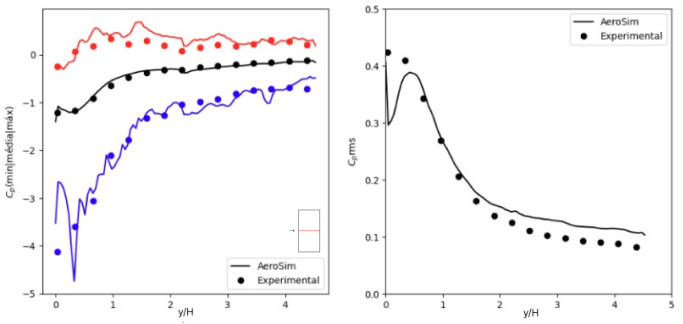
The figures below show a comparison between the experimentally and numerically obtained pressure coefficients, for wind incidences of 0° and 90°. All the coefficients were adjusted to a 10-minute dynamic pressure. The measurements were taken only on the roof, with one measurement line along the ridge and another transversely (from one end to the other of the roof). In these figures, side (a) displays the minimum, mean, and maximum pressure coefficients, while side (b) shows the root mean squared (rms) of the time series of pressure. The numerical solutions obtained by AeroSim’s digital wind tunnel are consistent with the experimental observations.
Design loads
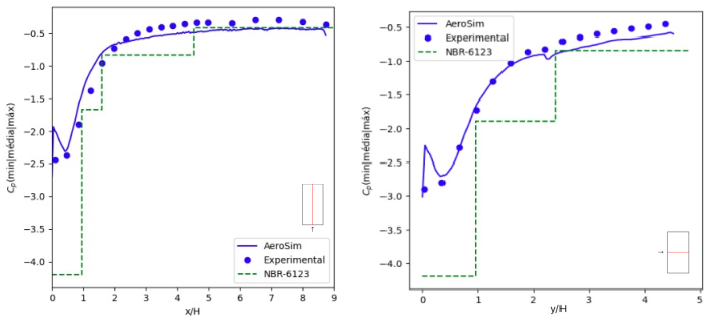
The pressure time series are characterized by short-duration peaks, which are crucial for defining extreme loads for design. Since the values of c_p max and min depend on the sampling and may contain significant volatility, there are different ways to define extreme values for design purposes. In this study, the peak factor is used: cp_peak = cp_mean ± g.cp_rms, where g is the peak factor, which typically ranges between 3 and 4. For the design of metallic roofing structures, the suction forces are more critical than the pressure forces. Hence, only the suction extremes are discussed below.
By calculating the peak coefficients with a peak factor of 4, the results shown in the figure below were obtained. This figure also includes the design values of the Brazilian wind code NBR 6123. The comparisons indicate that the Brazilian wind code provides suitable and safe values for the investigated case, although it may give conservative values at specific locations. This behavior is good and it is expected because the standards provide shape coefficients defined for large zones and offer results for a range of geometries, requiring a conservative approach even in well-documented and canonical cases.
Wind tunnel analysis (either experimental or digital) takes into account all the architectural features of the building and the wind pattern, including effects from neighboring structures or topography. Consequently, its results can significantly reduce uncertainties in design wind load. Considering the small differences observed between numerical and experimental results, the technical community has been manifesting in recent papers that the CFD-LES methodology can be used as a complementary tool in advanced studies, offering results compatible with engineering projects in the structural analysis of low-rise building.
Conclusions
The present article showcased a validation study of a numerical CFD-LES methodology implemented by AeroSim to calculate wind loads on the roof of a low-rise building. The methodology successfully reproduced the experimental results obtained in a wind tunnel for a standard two-sloped shed with good accuracy. Mean pressure values are not suitable for determining wind loads in structural design, which is why a transient CFD solution was employed, resolving the energetic portion of the turbulent spectrum. Consequently, extreme loads have been well represented. It should be noted that steady-state CFD simulations (e.g., RANS) are much more prevalent in the market compared to the approach used in this study. However, steady-state simulations are not appropriate for capturing pressure peaks that generate extreme loads. By employing the transient CFD-LES approach, AeroSim’s technology can successfully capture short-duration pressure peaks and provide valuable insights into extreme wind loads, which are crucial for structural design and safety assessments of buildings.