How to interpret a wind rose?
Learn what the bars, frequencies and ranges mean in a wind rose
 How to interpret a wind rose
A wind rose is a graphical representation used to indicate the cardinal, collateral, and sub-collateral directions on a plane. It is widely applied in navigation, cartography, meteorology, and geographic orientation. By reading it, one is able to know from which directions the prevailing winds come from, and even the typical speeds that are found throughout the year. Interpreting a wind rose may not be straightforward at first glance. Here we share the most important things to know if you want to understand a wind rose for mean hourly speeds.
Use in meteorology and human comfort
In the context of meteorology, the wind rose is a fundamental tool to graphically represent the predominant wind direction in a given location over a specific period. It provides a clear view of wind patterns, aiding in climate analysis and the planning of activities dependent on atmospheric conditions.
In addition, the wind rose is often complemented by isotach maps (lines representing values of equal wind speed, see below) or graphs detailing seasonal changes, creating a more comprehensive overview of a region’s atmospheric conditions, such as the example below.
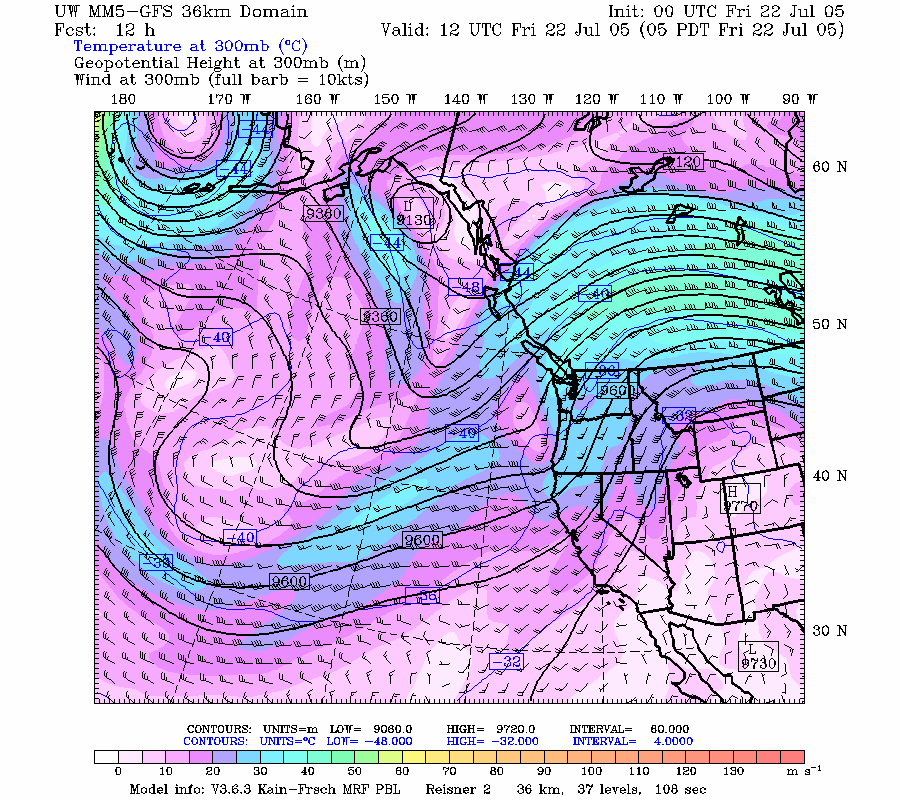
Source: https://a.atmos.washington.edu/wrfrt/descript/pages/300j.html
How to read a wind rose
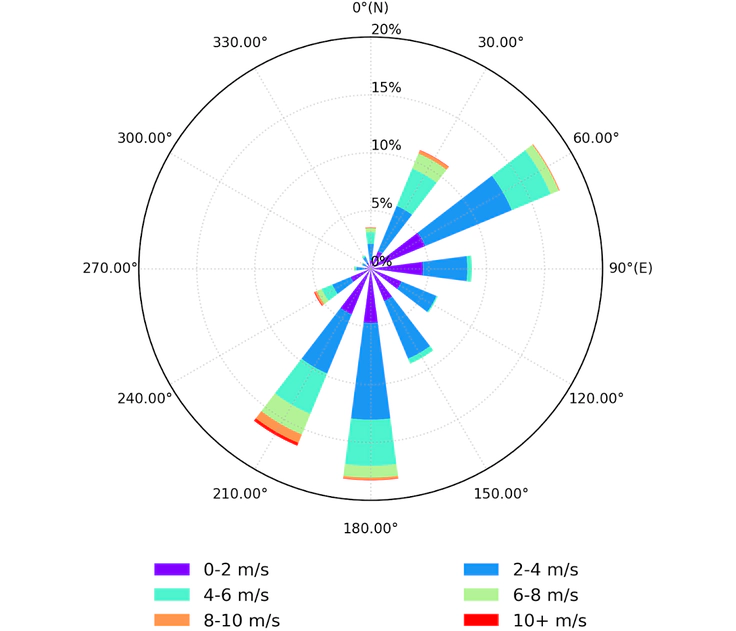
The chart is laid out in a radial format and consists of azimuths, which represent wind directions from the North (in degrees), and bars representing wind speed ranges (in meters per second). The height of these bars represents frequency: the proportion of the time in which velocities in that range manifested along the measured period. See the example wind rose below:
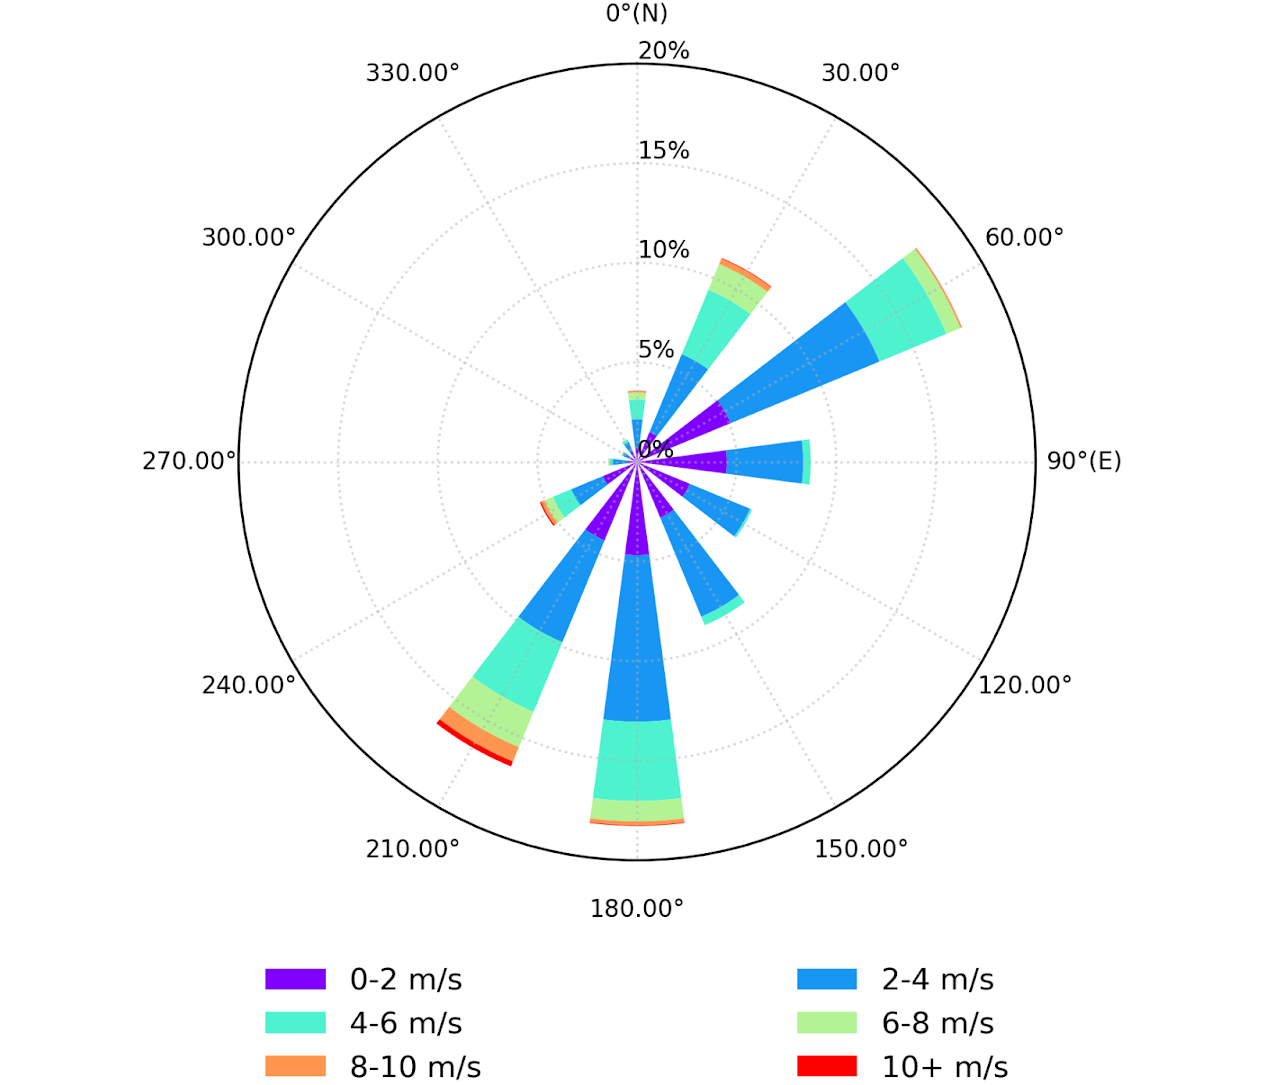
We have a chart that contains 12 directions, with speed ranges of 2 m/s. The barspointing to 180º and 60º are large, meaning that these azimuthal directions have the highest wind occurrences in the location the measurements were done. The directions 240° to 0° (N) have very low frequency values, indicating that winds seldom come from the northwest. The 2-4 m/s bars are the largest individual range, which means this is the most frequent wind speed.
By summing the frequency of all 2-4 m/s bars, we get the total frequency of that speed range, considering all possible directions. The sum of all bars in all directions must always be 1.
How we build them
This graphical representation can take various forms. In our internal processes, we use the planar wind rose, which can be configured with different numbers of directions, speed ranges, and include a cut-off speed range. Moreover, the wind rose does not need to align with the cardinal points. Wind roses can be derived for specific times of the year, such as winter or summer, and specific years, such as from 1980 to 2000.
Historical wind data typically comes in 36 directions (10º intervals). Sometimes, it is necessary to simplify the data for less directions, such as 18 or 16. For example, in pedestrian wind comfort analysis, if the number of wind tunnel simulations is 16, the directions of the wind rose have to match the wind tunnel directions. We do that by interpolating the cumulative probabilities of each velocity range, such that the total frequency remains unitary.
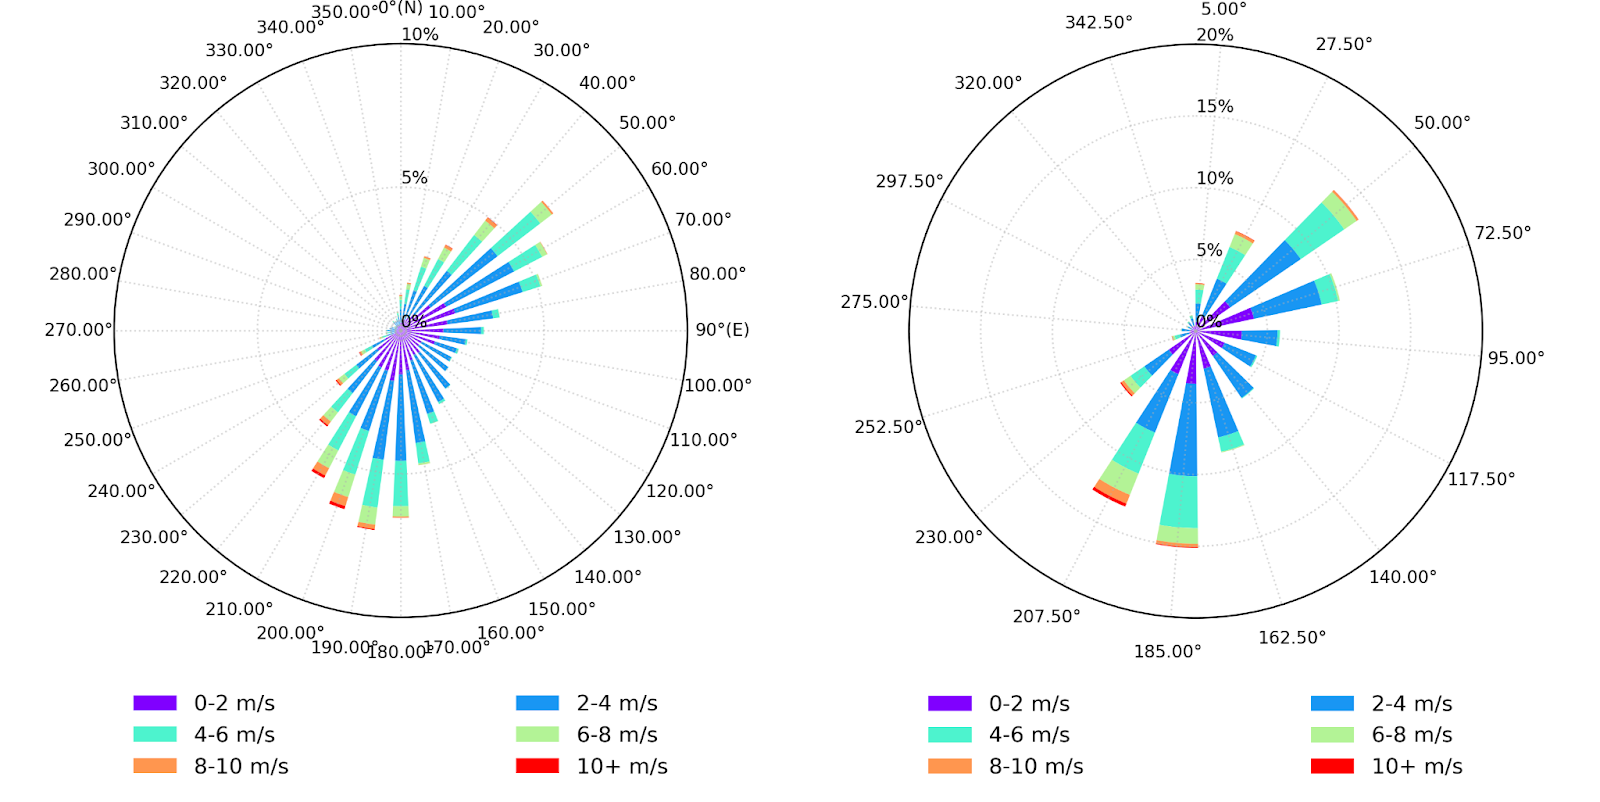
Left: wind rose with 36 directions. Right: interpolated wind rose with 16 directions.
Summary
The wind rose is a graphical tool used in meteorology to represent the predominant wind directions and speeds at a location over a measured time period. The radial chart indicates wind frequencies by direction and speed ranges, making it essential for climate analysis and building planning. It is possible to customize the wind rose to include different directions and speed ranges, complementing it with isotach maps and seasonal graphs for a more complete overview of atmospheric conditions.

Vinicius Gonçalves
Vinicius is an architect focused on software development for civil construction and building physics.